Example: For the function below. Graph using transformations. Find the y-intercept. State the horizontal asymptote and the domain and range.
=-2^{x+2}+2")
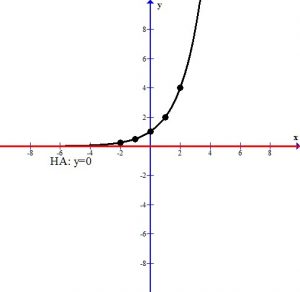
First we must examine the base function 
Graph using plotting points. We can use the standard set of x-values to find ordered pairs.
| x | y |
|---|---|
| -2 | 2^(-2)=1/4 |
| -1 | 2^(-1)=1/2 |
| 0 | 2^0=1 |
| 1 | 2^1=2 |
| 2 | 2^2=4 |
The graph below shows the points plotted and the line that connects them. This graph has a horizontal asymptote at y=0. The domain is ") and the range is
and the range is ")
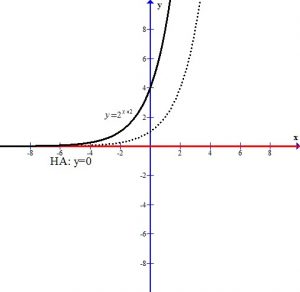
Analyze the transformations.
The +2 in the exponent shifts the graph left 2 units.
The – in the front of the base reflects the graph over the x-axis.
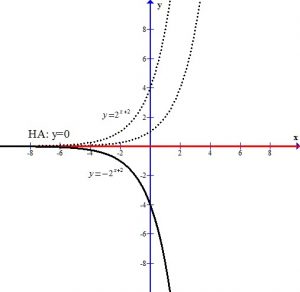
The +2 next to the base shifts the graph and the horizontal asymptote up two units.
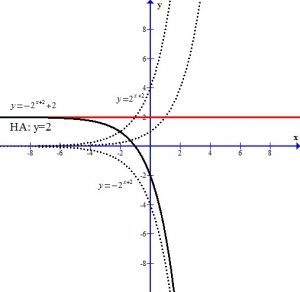
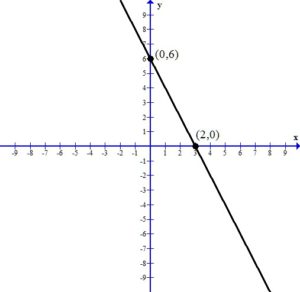
You can see the graph after the transformations.
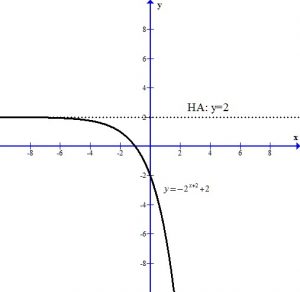
The horizontal asymptote is y=2. The domain is and the range is ")
To find the y-intercept we let x=0.
=-2^{0+2}+2")
=-(2^{2})+2")
=-(4)+2")
=-4+2")
=-2")
Thus the y-intercept is (0,-2)
Here is a youtube video with examples.
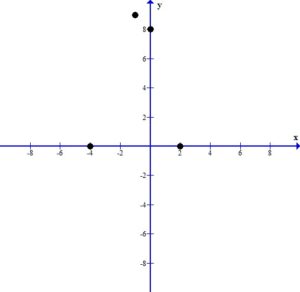
=-x^2-2x+8")
=-(x^2+2x)+8")
=-(x^2+2x+1)+8+1")
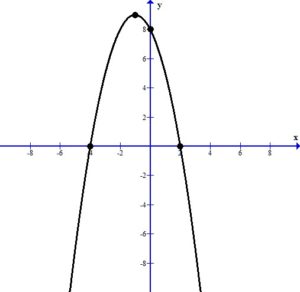
=-(x+1)^2+9")
=a(x-h)^2+k")
") .
.=-(0+1)^2+9")
=-(1)^2+9")
=-1+9")
=8")
^2+9")
^2+9-9")
^2")
^2}/{-1}")
^2")
^2}")


 or
or 
 or
or 
 .
.

![- infty, 9 {}{]}](http://math15fun.com/wp-content/plugins/wpmathpub/phpmathpublisher/img/math_981_cf307bba3f49c962fc8d40a950c676b1.png "- infty, 9 {}{]}") .
.") and B is
and B is ")
^2+ (y_2-y_1)^2}")
^2+ (y-3)^2}")
^2+ (y-3)^2}")
^2}")
^2})^2")
^2")
^2")
^2")
^2}")


 or
or 
 or
or 
") and point B is
and point B is ")
^2+ (3-(-2))^2}")
^2+ (3+2)^2}")
^2}")


") and B is
and B is ")
")
}/2, {-2+3}/2)")
")
")
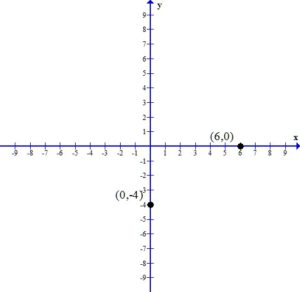
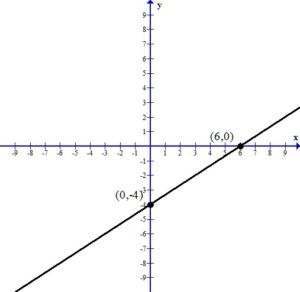
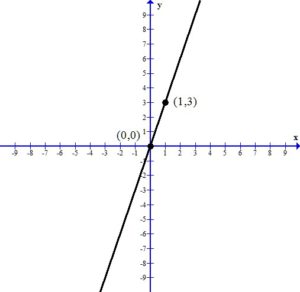
") . Since every ordered pair on the x-axis has a y coordinate of zero we can let
. Since every ordered pair on the x-axis has a y coordinate of zero we can let  to find x-intercepts.
") . Since every ordered pair on the y-axis has a x coordinate of zero we can let
. Since every ordered pair on the y-axis has a x coordinate of zero we can let  to find y-intercepts.
 = 12")


")
-3y = 12")


")


")
")
")

")
^2+(y+2)^2=4")
^2+(0+2)^2=4")
^2+(2)^2=4")
^2+4=4")
^2+4-4=4-4")
^2=0")
^2}=sqrt{0}")


")
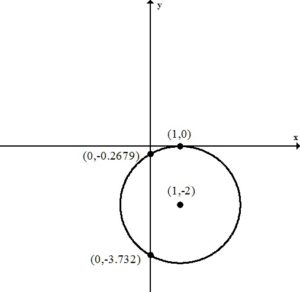
^2+(y+2)^2=4")
^2+(y+2)^2=4")
^2=4")
^2+1-1=4-1")
^2=3")
^2}=sqrt{3}")


 and
and 
") and
and ")
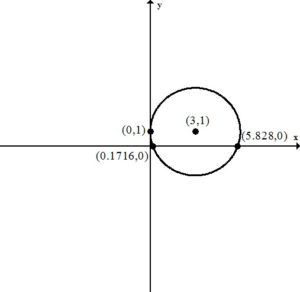
^2+(y-1)^2=9")
^2+(0-1)^2=9")
^2+(-1)^2=9")
^2+1=9")
^2+1-1=9-1")
^2=8")
^2}=sqrt{8}")


 and
and 
") and
and ")
^2+(y-1)^2=9")
^2+(y-1)^2=9")
^2=9")
^2+9-9=9-0")
^2=0")
^2}=sqrt{0}")


") .
.