The slope of a line is a number that indicates the “steepness” of a line. Slope is usually denoted with the letter m.
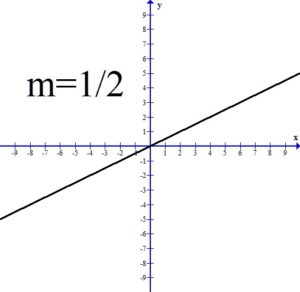
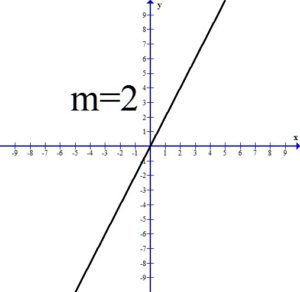
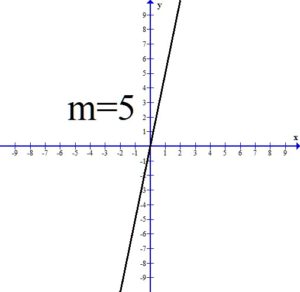
If the slope of the line is positive, the line will be rising or increasing from left to right.
All three of the above graphs have a positive slope and the line is rising or increasing from left to right. Notice as the value of the slope gets larger, the line is getting steeper.
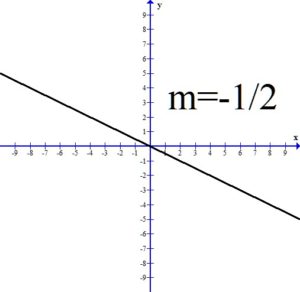
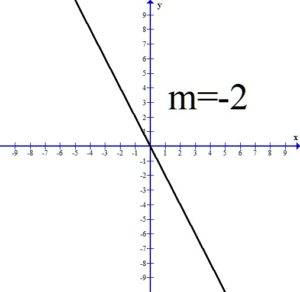
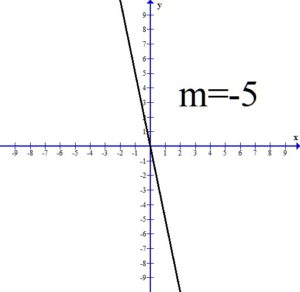
If the slope of the line is negative, the line will be falling or decreasing from left to right.
All three of the above graphs have a negative slope and the line is falling or decreasing from left to right. Notice as the value of the slope gets smaller, the line is getting steeper.
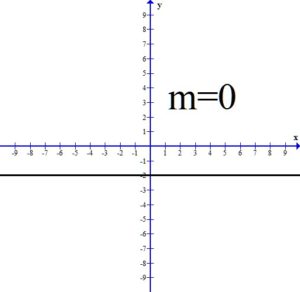
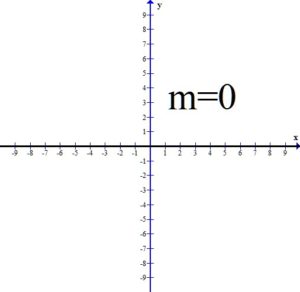
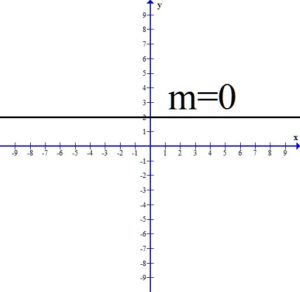
If the slope is zero, the line will be constant. This results in a horizontal line.
All three of the the above graphs have a slope of zero. The y values are constant.
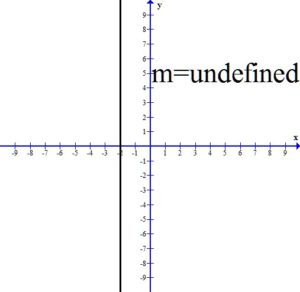
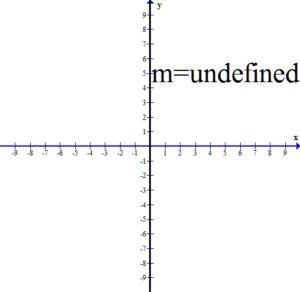
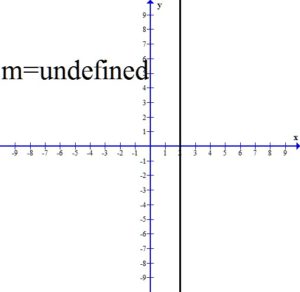
A vertical line has a slope that is undefined.
All three of the vertical lines have undefined slope.
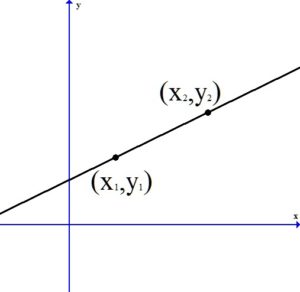
") and
and ") , you can calculate the slope of a line by the following formula.
, you can calculate the slope of a line by the following formula.
 is also know as
  or “the change in y.”
 is also know as
  or “the change in x.”
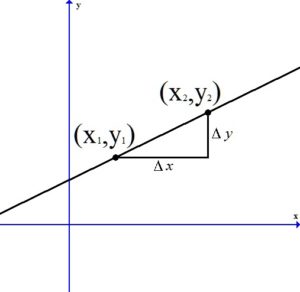

") and
and ") .
.
 .
.") and
and ") .
.}/{8-(-7)}={8+2}/{8+7} =10/15=2/3")
 .
.