Slope Intercept Form

m is the slope of the line and ") is the y-intercept
is the y-intercept
Point Slope Form
")
m is the slope of the line and ") is a point on the line.
is a point on the line.
Standard Form of a Line

Slope Intercept Form
m is the slope of the line and is the y-intercept
Point Slope Form
m is the slope of the line and is a point on the line.
Standard Form of a Line
Example: Graph the linear equation using the slope and the y-intercept. (the slope is positive and fractional)
Example: Graph the linear equation using the slope and the y-intercept. (positive and negative fractional slopes)
Example: Graph the linear equation using the slope and the y-intercept. (equation written in standard form)
Example: Find the equation of a line in slope intercept form given the slope of the line is  and the line passes through the point
 ")
Solution:
Use the point-slope formula of the line to start building the line. m represents the slope of the line and is a point on the line.
Point-slope formula: ")
 and
and
Substitute the values into the formula.
)")
Since the instructions ask to write the equation in slope intercept form ") we will simplify and write the equation with y by itself on one side. I will also use the clearing fractions method to avoid having to add fractions.
we will simplify and write the equation with y by itself on one side. I will also use the clearing fractions method to avoid having to add fractions.
![3(y-7) = 3[-{2/3}(x+4)]](http://math15fun.com/wp-content/plugins/wpmathpub/phpmathpublisher/img/math_980_0233a6f7265fc4d6a65d52d25e31bbd1.png "3(y-7) = 3[-{2/3}(x+4)]") (Multiply by LCM)
(Multiply by LCM)
 = -2(x+4)") (Cancel Denominator)
(Cancel Denominator)


The equation of a line in slope intercept form with a slope of and passing through the point is 
Example: Find the equation of a line in slope intercept form given the line passes through the two points ") and
and ") .
.
Solution:
First find the slope of the line.
Choose one of the points to be ") and choose the other point to be
and choose the other point to be ") .
.
I will choose ") to be and choose
to be and choose ") to be .
to be .
Substitute these values into the slope formula and simplify.
}/{6-5}={-1+3}/{1} =2/1=2")
The slope of the line containing the points and is  .
.
Then, use the point-slope formula of the line to start building the line. m represents the slope of the line and you can use or ") as the point on the line.
as the point on the line.
Point-slope formula: ")
 and
and
Substitute the values into the formula.
 = 2(x-5)")
Since the instructions ask to write the equation in slope intercept form we will simplify and write the equation with y by itself on one side.


The equation of a line in slope intercept form passing through the two points and is .
Example: Find the equation of a line in slope intercept form given the slope of the line is 7 and the line passes through the point ")
Solution:
Use the point-slope formula of the line to start building the line. m represents the slope of the line and is a point on the line.
Point-slope formula:
 and
and
Substitute the values into the formula.
 = 7(x-2)")
Since the instructions ask to write the equation in slope intercept form we will simplify and write the equation with y by itself on one side.


The equation of a line in slope intercept form with a slope of 7 and passing through the point is .
Example: Find the equation of the line.
An x-intercept is where the graph touches or crosses the x-axis.
A y-intercept is where the graph touches of crosses the y-axis.
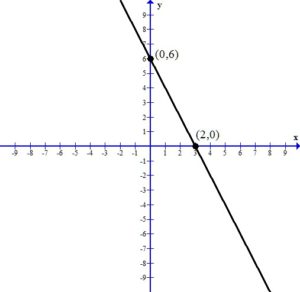
In this picture, the graph crosses the x-axis at the ordered pair ") . Since every ordered pair on the x-axis has a y coordinate of zero we can let
. Since every ordered pair on the x-axis has a y coordinate of zero we can let  to find x-intercepts.
To find an x-intercept: Let y=0 and solve for x.
In this picture, the graph crosses the y-axis at the ordered pair ") . Since every ordered pair on the y-axis has a x coordinate of zero we can let
. Since every ordered pair on the y-axis has a x coordinate of zero we can let  to find y-intercepts.
To find an y-intercept: Let x=0 and solve for y.
Steps for Graphing with the Intercept Method
Example: Graph the linear equation 
Solution:
1. Find the x-intercept and the y-intercept.
To find an x-intercept: Let y=0 and solve for x.
 = 12")


The x-intercept of this equation is ")
To find a y-intercept: Let x=0 and solve for y.
-3y = 12")


The y-intercept of this equation is ")
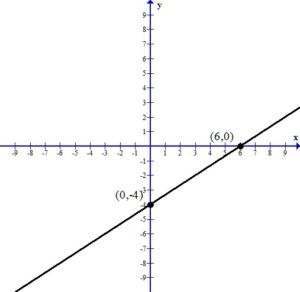
2. Plot the x-intercept and the y-intercept.
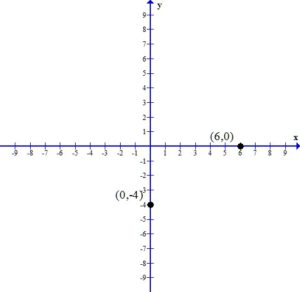
3. Draw the line that connects the intercepts.
Example: Graph the linear equation 
Solution:
1. Find the x-intercept and the y-intercept.
To find an x-intercept: Let y=0 and solve for x.


The x-intercept of this equation is ")
To find a y-intercept: Let x=0 and solve for y.
")
The y-intercept of this equation is
Since the x-intercept and the y-intercept are the same point and we need two distinct points to graph a line, we must find another ordered pair that is a solution to the equation.
Let x=1 and find the associated y value. (I chose x=1 but you could choose a different value)
")

Another ordered pair on the graph is ")
2. Plot the x-intercept and the y-intercept.
3. Draw the line that connects the intercepts.
Example: Graphing a linear equation with intercepts.
Example: Graphing a linear equation with intercepts.
Example: Graphing a linear equation with intercepts.
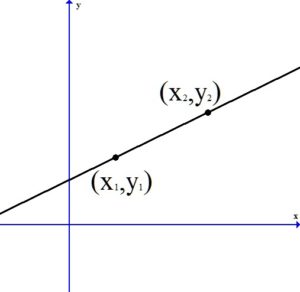
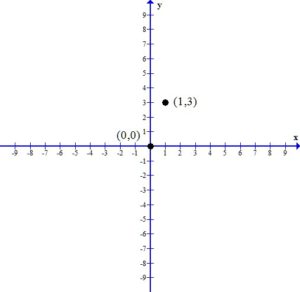
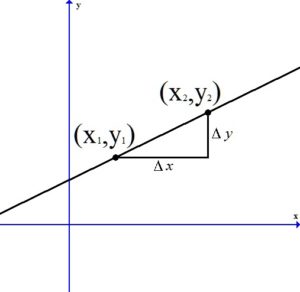
Given two points on the line ") and
and ") , you can calculate the slope of a line by the following formula.
, you can calculate the slope of a line by the following formula.

 is also know as
  or “the change in y.”
 is also know as
  or “the change in x.”

Example: Calculate the slope of the line containing the points ") and
and ") .
.
Solution: Choose one of the points to be and choose the other point to be .
I will choose to be and choose to be .
Substitute these values into the slope formula and simplify.

The slope of the line containing the points and is  .
.
Example: Calculate the slope of the line containing the points ") and
and ") .
.
Solution: Choose one of the points to be and choose the other point to be .
I will choose to be and choose to be .
Substitute these values into the slope formula and simplify.
}/{8-(-7)}={8+2}/{8+7} =10/15=2/3")
The slope of the line containing the points and is  .
.
Example: Finding the slope with the formula.
Example: Finding the slope with the formula.
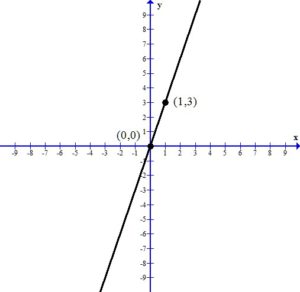
Example: Finding the slope from the graph.
The slope of a line is a number that indicates the “steepness” of a line. Slope is usually denoted with the letter m.
If the slope of the line is positive, the line will be rising or increasing from left to right.
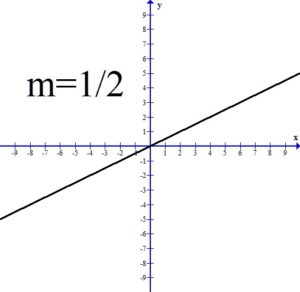
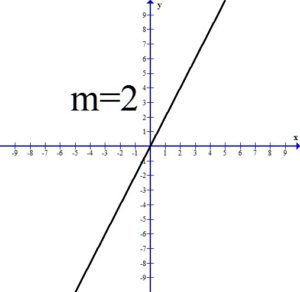
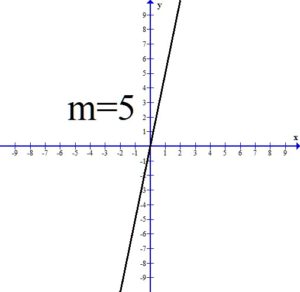
All three of the above graphs have a positive slope and the line is rising or increasing from left to right. Notice as the value of the slope gets larger, the line is getting steeper.
If the slope of the line is negative, the line will be falling or decreasing from left to right.
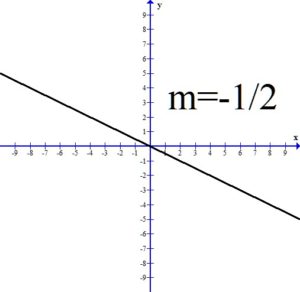
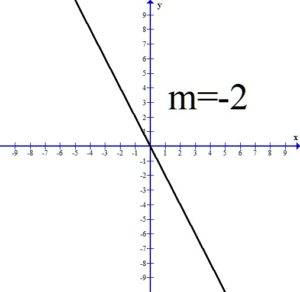
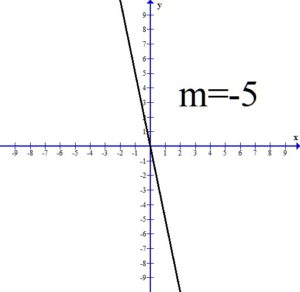
All three of the above graphs have a negative slope and the line is falling or decreasing from left to right. Notice as the value of the slope gets smaller, the line is getting steeper.
If the slope is zero, the line will be constant. This results in a horizontal line.
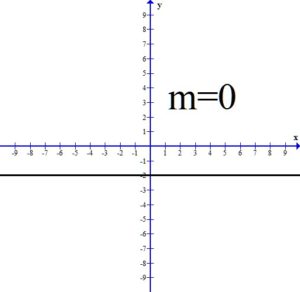
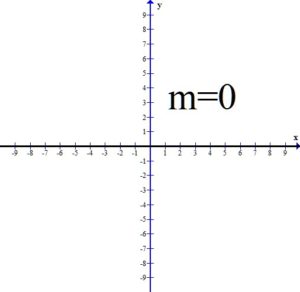
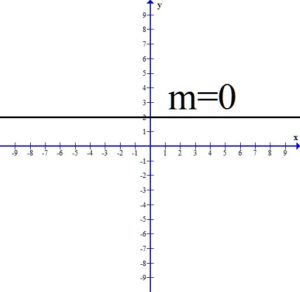
All three of the the above graphs have a slope of zero. The y values are constant.
A vertical line has a slope that is undefined.
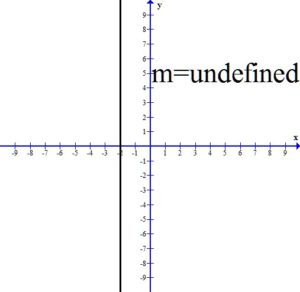
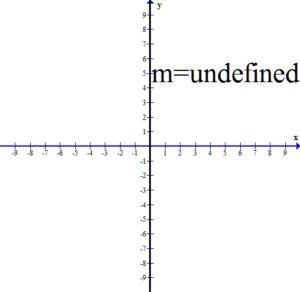
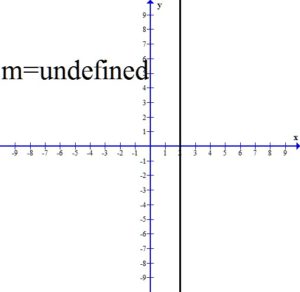
All three of the vertical lines have undefined slope.