Steps for Graphing with the Intercept Method
- Find the x intercept and the y-intercept.
- To find an x-intercept let y=0 and solve for x.
- To find a y-intercept let x=0 and solve for y.
- Plot the x-intercept and y-intercept.
- Draw the line that connects the intercepts.
Example: Graph the linear equation 
Solution:
1. Find the x-intercept and the y-intercept.
To find an x-intercept: Let y=0 and solve for x.
 = 12")


The x-intercept of this equation is ")
To find a y-intercept: Let x=0 and solve for y.
-3y = 12")


The y-intercept of this equation is ")
2. Plot the x-intercept and the y-intercept.
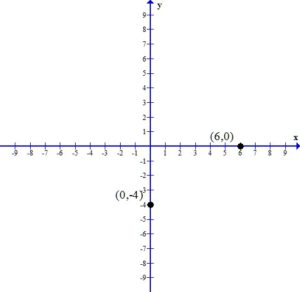
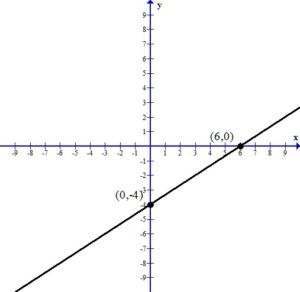
3. Draw the line that connects the intercepts.
Example: Graph the linear equation 
Solution:
1. Find the x-intercept and the y-intercept.
To find an x-intercept: Let y=0 and solve for x.


The x-intercept of this equation is ")
To find a y-intercept: Let x=0 and solve for y.
")

The y-intercept of this equation is
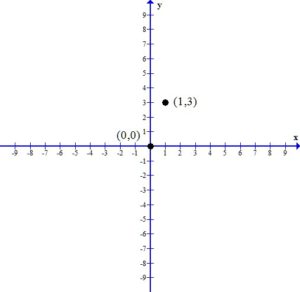
Since the x-intercept and the y-intercept are the same point and we need two distinct points to graph a line, we must find another ordered pair that is a solution to the equation.
Let x=1 and find the associated y value. (I chose x=1 but you could choose a different value)
")

Another ordered pair on the graph is ")
2. Plot the x-intercept and the y-intercept.
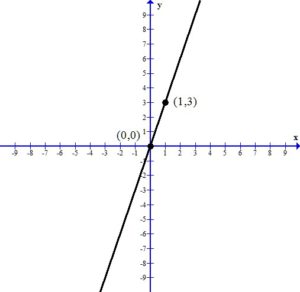
3. Draw the line that connects the intercepts.
Example: Graphing a linear equation with intercepts.
Example: Graphing a linear equation with intercepts.
Example: Graphing a linear equation with intercepts.