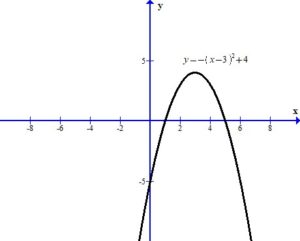
Example: For the function below. Graph using transformations.
=-(x-3)^2+4")
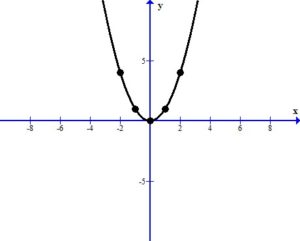
First we must examine the base function 
Graph using plotting points. We can use the standard set of x-values to find ordered pairs. Substitute the standard set of x-values into the base function to get the base graph.
| x | y |
|---|---|
| -2 | (-2)^2=4 |
| -1 | (-1)^2=1 |
| 0 | (0)^2=0 |
| 1 | (1)^2=1 |
| 2 | (2)^2=4 |
The graph below shows the points plotted and the line that connects them. The domain is ") and the range is [
and the range is [ )
)
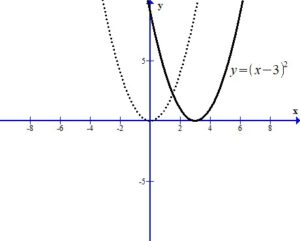
Analyze the transformations.
The -3 inside the square shifts the graph right 3 units.
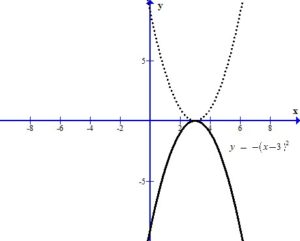
The – in the front of the base reflects the graph over the x-axis.
The +4 outside the square shifts the graph up 4 units.
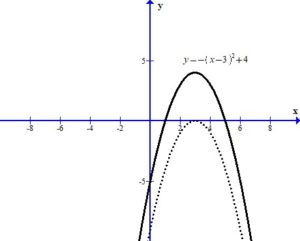
You can see the graph after the transformations.
The domain is and the range is ( ]
]
Here is a video example of a transformation of a square function.