Category Archives: Sullivan Chapter 4
Compound Inequalities
Quadratic Function: General Form
Example: Rewrite the given quadratic function in standard form by completing the square. Then state the domain, range, vertex, x-intercepts, y-intercept, the orientation (opens up or opens down), and the axis of symmetry. Finally graph the function.
=-x^2-2x+8")
Solution:
Rewrite function in standard form.
=-(x^2+2x)+8")
=-(x^2+2x+1)+8+1")
=-(x+1)^2+9")
Here is a youTube video that demonstrations the process.
Find the vertex.
When the quadratic function is written in standard form you can identify the vertex as (h,k).
=a(x-h)^2+k")
The vertex of the quadratic function is ") .
.
Find the orientation.
The leading coefficient of the quadratic function is negative so the parabola opens down.
Find the y-intercept.
To find a y-intercept let x=0.
=-(0+1)^2+9")
=-(1)^2+9")
=-1+9")
=8")
The y-intercept is (0,8).
Find the x-intercept.
To find an x-intercept let y=0 or f(x)=0.
^2+9")
^2+9-9")
^2")
^2}/{-1}")
^2")
^2}")


 or
or 
 or
or 
Find the axis of symmetry.
The axis of symmetry is a vertical line that passes through the vertex. Since the vertex is the axis of symmetry is  .
.
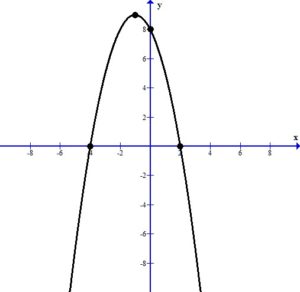
Graph the function.
Plot the intercepts and the vertex.
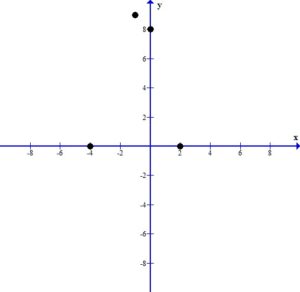
Since the vertex is the highest point we can draw the parabola using the peak at the vertex.
Find the domain and range.
The domain is ") .
.
The range is 
![- infty, 9 {}{]}](http://math15fun.com/wp-content/plugins/wpmathpub/phpmathpublisher/img/math_981_cf307bba3f49c962fc8d40a950c676b1.png "- infty, 9 {}{]}") .
.
Here a few video examples of analyzing the graph in general form.
Graphing Linear Equations with Slope Intercept Form
Example: Graph the linear equation using the slope and the y-intercept. (the slope is positive and fractional)
Example: Graph the linear equation using the slope and the y-intercept. (positive and negative fractional slopes)
Example: Graph the linear equation using the slope and the y-intercept. (equation written in standard form)
Interpretation of slope
The slope of a line is a number that indicates the “steepness” of a line. Slope is usually denoted with the letter m.
If the slope of the line is positive, the line will be rising or increasing from left to right.
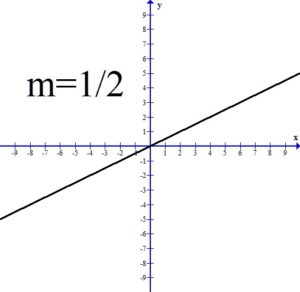
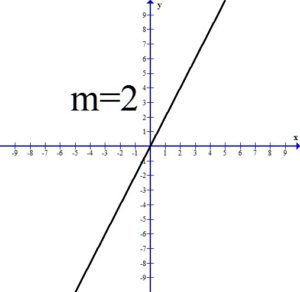
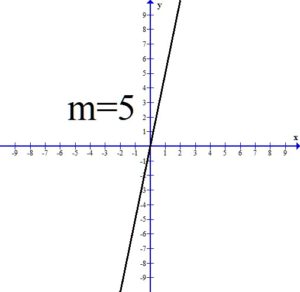
All three of the above graphs have a positive slope and the line is rising or increasing from left to right. Notice as the value of the slope gets larger, the line is getting steeper.
If the slope of the line is negative, the line will be falling or decreasing from left to right.
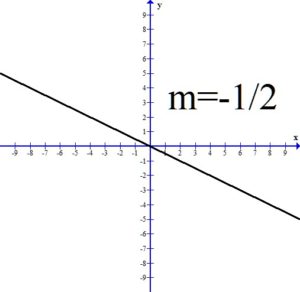
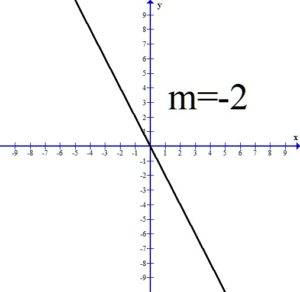
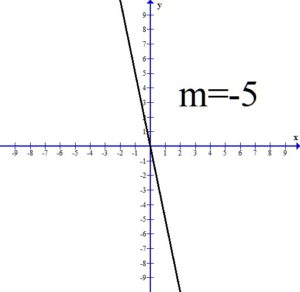
All three of the above graphs have a negative slope and the line is falling or decreasing from left to right. Notice as the value of the slope gets smaller, the line is getting steeper.
If the slope is zero, the line will be constant. This results in a horizontal line.
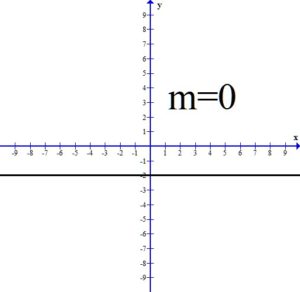
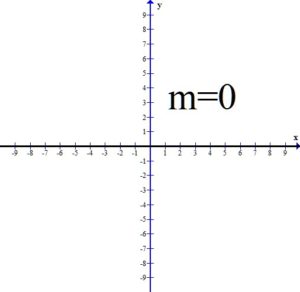
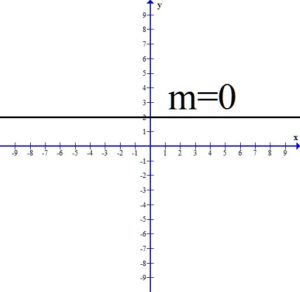
All three of the the above graphs have a slope of zero. The y values are constant.
A vertical line has a slope that is undefined.
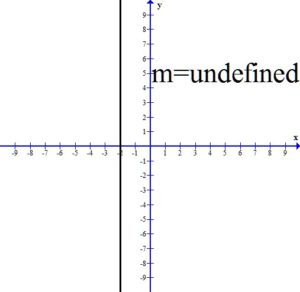
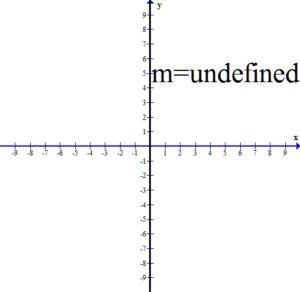
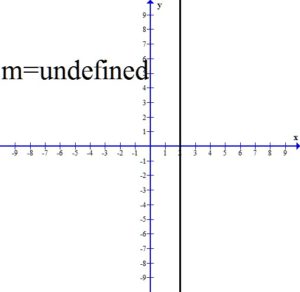
All three of the vertical lines have undefined slope.