Category Archives: 4.1 Linear Functions and Their Properties
Interval Notation
Solving Linear Equations: Two Step Equations
Average Rate of Change
Compound Inequalities
Graphing Linear Equations with Slope Intercept Form
Example: Graph the linear equation using the slope and the y-intercept. (the slope is positive and fractional)
Example: Graph the linear equation using the slope and the y-intercept. (positive and negative fractional slopes)
Example: Graph the linear equation using the slope and the y-intercept. (equation written in standard form)
Interpretation of slope
The slope of a line is a number that indicates the “steepness” of a line. Slope is usually denoted with the letter m.
If the slope of the line is positive, the line will be rising or increasing from left to right.
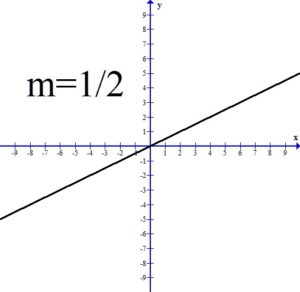
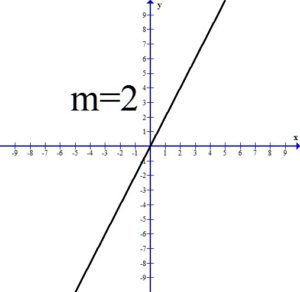
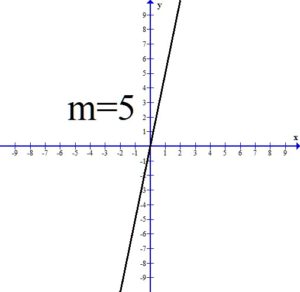
All three of the above graphs have a positive slope and the line is rising or increasing from left to right. Notice as the value of the slope gets larger, the line is getting steeper.
If the slope of the line is negative, the line will be falling or decreasing from left to right.
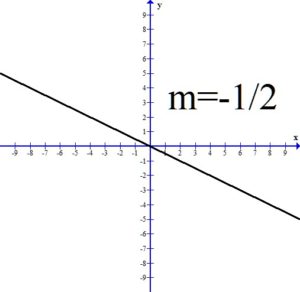
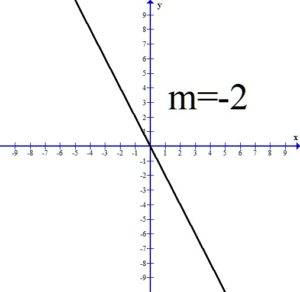
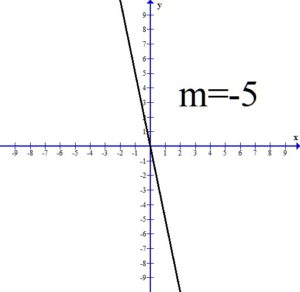
All three of the above graphs have a negative slope and the line is falling or decreasing from left to right. Notice as the value of the slope gets smaller, the line is getting steeper.
If the slope is zero, the line will be constant. This results in a horizontal line.
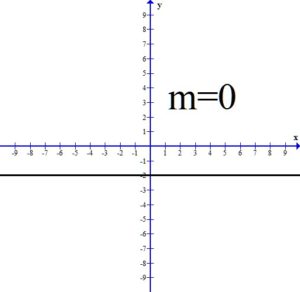
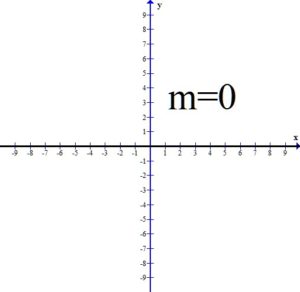
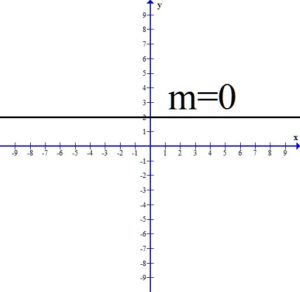
All three of the the above graphs have a slope of zero. The y values are constant.
A vertical line has a slope that is undefined.
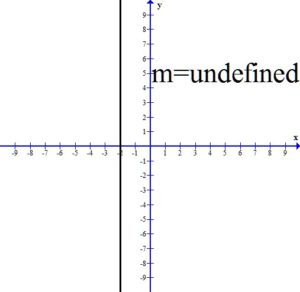
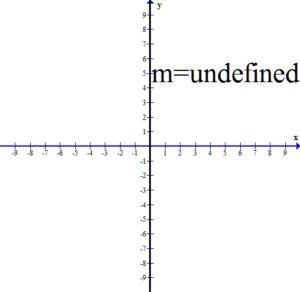
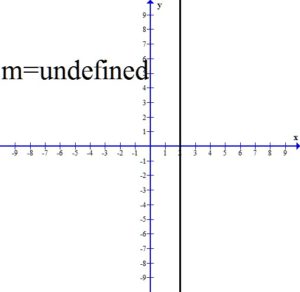
All three of the vertical lines have undefined slope.