Category Archives: Sullivan Chapter 3
Finding Intercepts from a Graph
Even, Odd, or Neither
Example: Determine if the function is even, odd, or neither.

Background Knowledge:
For a function to be even it must fit the following definition.

In words, this means that  must equal the same expression as the original function.
For a function to be odd it must fit the following definition.

In words, this means that  must equal the opposite expression as the original function.
We will calculate  for the given function and determine if it fits either definition.
Solution:
We will calculate  for
for and determine if it fits either definition.
 |
 |
 . .
|
   |
 . .
|
   |
Is the function even? No,  is not the same as the original function.
Is the function odd? No,  is not the opposite of the original function.
This function is not even or odd so we categorize it as “neither.”
YouTube Videos
Y-axis symmetry, x-axis symmetry, origin symmetry, even function, odd function from the graph
Increasing, Decreasing and Constant
Finding Domain and Range from the Graph
Evaluating Functions
Finding Function Values from the graph
Here are some practice problems so you can try it yourself.
Finding Domain: Radical/Root Function (Even Root)
Example: Classify the function as a polynomial function, rational function, or root function, and then find the domain. Write the domain interval notation and set builder notation.

Solution:
Classify the Function
| Polynomial Function
A polynomial function is a function of the form
where n is a non-negative integer {0, 1, 2, 3, 4, …} and the coefficients |
|
| Rational Function
A rational function is a function of the form
where |
|
| Root Function (even index)
A root function is a function of the form
where n is an even positive integer greater than or equal to 2. |
The variable is inside or underneath a radical. The index of the radical is an even number. {2, 4, 6, 8, …} The square root is an even index although the index is not written. |
| Root Function (odd index)
A root function is a function of the form
where n is an odd positive integer greater than or equal to 2. |
The variable is inside or underneath a radical. The index of the radical is an odd number. {3, 5, 7, 9, …} The cube root is an odd index. |
Since the function  has a radical and the index is even. This function is a root function.
Find the Domain of a Root Function (Even Index)
Taking the even root of a negative number results in a complex or imaginary number. Since we are interested in real function values, we would like the expression inside the radical to be non-negative ( zero or positive) The root function is defined for any value of the variable where the expression under the radical is non-negative (zero or positive). Find these values by creating an inequality to solve. The inequality is the expression under the radical greater than or equal to zero.
 |
|
| Solve the inequality. This inequality is a linear inequality and can be solved by isolating the variable on one side. |  |
| Solve by isolating the variable. Start by subtracting 2 on both sides. |         |
| Isolate the variable. Continue by dividing both sides by -1. Be sure to reverse the inequality symbol since you are dividing both sides by a negative. |      |
The function values where  are defined for
  .
.
In set builder notation, the domain is ![]() .
.
In interval notation, the domain is ( ]
]
Graphing by Transformations: Quadratic
Example: For the function below. Graph using transformations.

First we must examine the base function 
Graph using plotting points. We can use the standard set of x-values to find ordered pairs. Substitute the standard set of x-values into the base function to get the base graph.
| x | y |
|---|---|
| -2 | (-2)^2=4 |
| -1 | (-1)^2=1 |
| 0 | (0)^2=0 |
| 1 | (1)^2=1 |
| 2 | (2)^2=4 |
The graph below shows the points plotted and the line that connects them. The domain is  and the range is [
 )
)
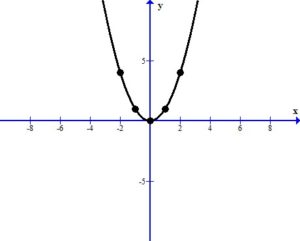
Analyze the transformations.

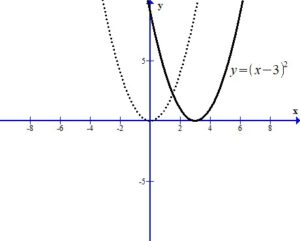
The -3 inside the square shifts the graph right 3 units.
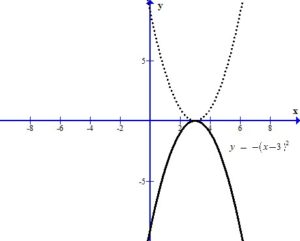
The – in the front of the base reflects the graph over the x-axis.
The +4 outside the square shifts the graph up 4 units.
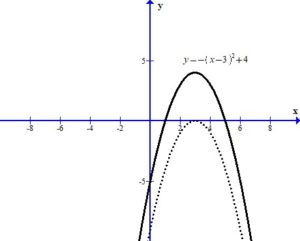
You can see the graph after the transformations.
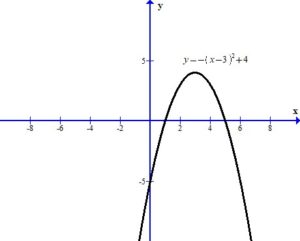
The domain is  and the range is (
 ]
]
Here is a video example of a transformation of a square function.


 are from the real numbers.
 and
and  are polynomial functions and