Category Archives: 3.5 Graphing Techiques: Transformations
Transformation of Functions: Transforming the Square Root Function
Transformation of Functions: Horizontal and Vertical Reflections
Transformations of Functions: Vertical and Horizontal Shifts
Transformation of Functions: Vertical and Horizontal Stretch and Compression
Graphing by Transformations: Quadratic
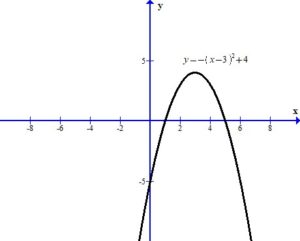
Example: For the function below. Graph using transformations.
=-(x-3)^2+4")
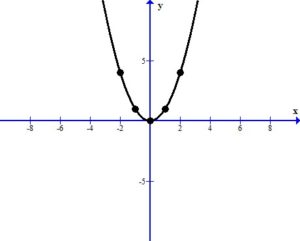
First we must examine the base function 
Graph using plotting points. We can use the standard set of x-values to find ordered pairs. Substitute the standard set of x-values into the base function to get the base graph.
The graph below shows the points plotted and the line that connects them. The domain is ") and the range is [
and the range is [ )
)
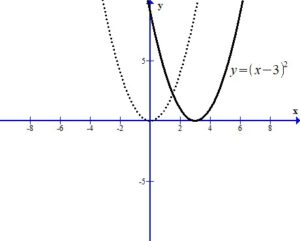
Analyze the transformations.
The -3 inside the square shifts the graph right 3 units.
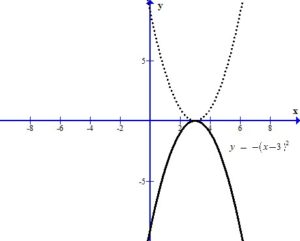
The – in the front of the base reflects the graph over the x-axis.
The +4 outside the square shifts the graph up 4 units.
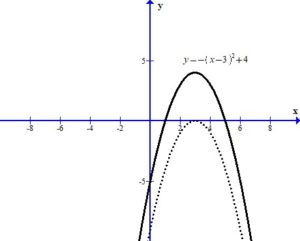
You can see the graph after the transformations.
The domain is and the range is ( ]
]
Here is a video example of a transformation of a square function.
Graphing an Exponential Equation by Transformations
Example: For the function below. Graph using transformations. Find the y-intercept. State the horizontal asymptote and the domain and range.
=-2^{x+2}+2")
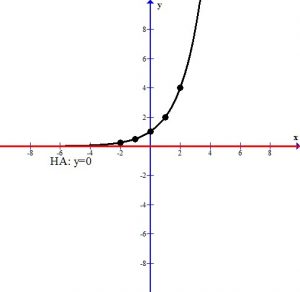
First we must examine the base function 
Graph using plotting points. We can use the standard set of x-values to find ordered pairs.
The graph below shows the points plotted and the line that connects them. This graph has a horizontal asymptote at y=0. The domain is and the range is ")
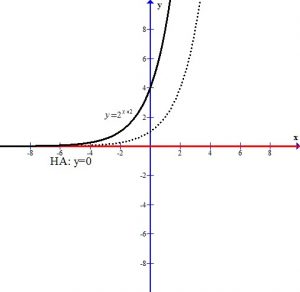
Analyze the transformations.
The +2 in the exponent shifts the graph left 2 units.
The – in the front of the base reflects the graph over the x-axis.
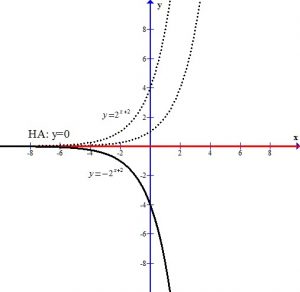
The +2 next to the base shifts the graph and the horizontal asymptote up two units.
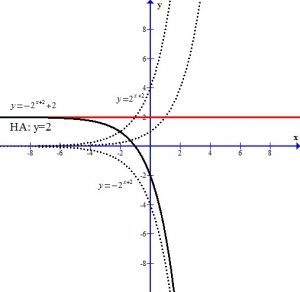
You can see the graph after the transformations.
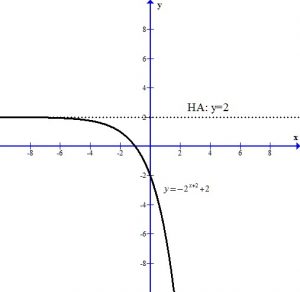
The horizontal asymptote is y=2. The domain is and the range is ")
To find the y-intercept we let x=0.
=-2^{0+2}+2")
=-(2^{2})+2")
=-(4)+2")
=-4+2")
=-2")
Thus the y-intercept is (0,-2)
Here is a youtube video with examples.