Example: For the function below. Graph using transformations. Find the y-intercept. State the horizontal asymptote and the domain and range.

First we must examine the base function 
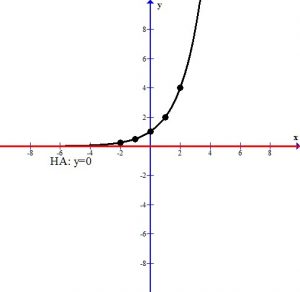
Graph using plotting points. We can use the standard set of x-values to find ordered pairs.
The graph below shows the points plotted and the line that connects them. This graph has a horizontal asymptote at y=0. The domain is  and the range is
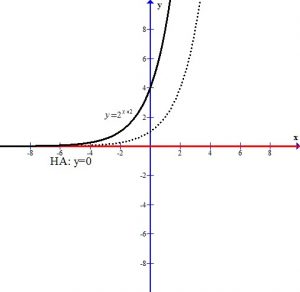
Analyze the transformations.

The +2 in the exponent shifts the graph left 2 units.
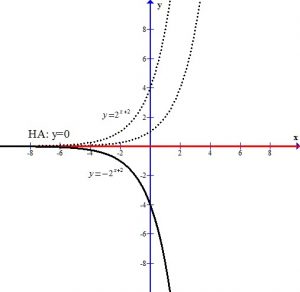
The – in the front of the base reflects the graph over the x-axis.
The +2 next to the base shifts the graph and the horizontal asymptote up two units.
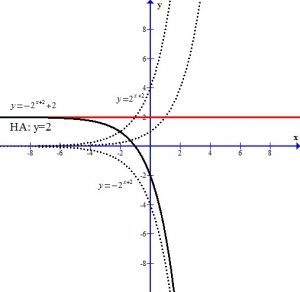
You can see the graph after the transformations.
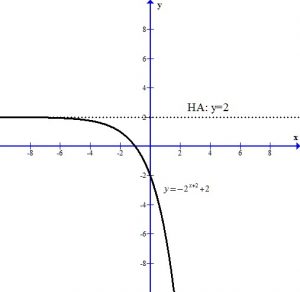
The horizontal asymptote is y=2. The domain is  and the range is
To find the y-intercept we let x=0.


Thus the y-intercept is (0,-2)
Here is a youtube video with examples.