The formula for n objects taken j at a time is.

Example:


The formula for n objects taken j at a time is.

Example:


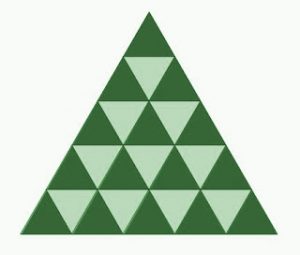
A quilt is designed in the shape of an equilateral triangle, 5 inches on each side. Each section of the quilt is in the shape of an equilateral triangle, 1 inch on a side. The sections are to alternate in color as show in the picture. How many dark green sections will be required? How many light green sections will be required?

Dark Green Sections
You can use an arithmetic sequence to represent the number of triangles in each row since the number of triangles increases by 1 in the next consecutive row.
The formula for the nth term of an arithmetic sequence is below.

d is the common difference and  is the first term in the sequence.
For the dark green sections, there is one dark green triangle in the first row and the number of dark green triangles increases by 1 in the next row. This means  and
and 
Using the formula the nth term of the arithmetic sequence is the following.


Now that the nth term of the sequence has been established we will find the sum of the rows. Each term of the sequence represents the number of dark green triangles are in that row. Summing the terms of the sequence is finding the total number of dark green triangles.
The formula for the sum of the first n terms of an arithmetic sequence is below.
![S_n=sum{i=1}{n}{{[}{{a_1+(i-1)d}}}{]}= n/2(a_1+a_n) S_n=sum{i=1}{n}{{[}{{a_1+(i-1)d}}}{]}= n/2(a_1+a_n)](https://math15fun.com/wp-content/plugins/wpmathpub/phpmathpublisher/img/math_957.5_976d6fb39024cedb0ec1dc70cd4fcf52.png)
There are five rows of dark green triangles. The sum the first five rows of dark green triangles is represented by the symbols below.

To use the formula we need the first term, the last term and n. The first term in the sequence is 1 (1 dark green triangle in the first row. The last term in the sequence is 5 (5 dark green triangles in the last row. Since there are a total of 5 rows, n is 5.


The number of dark green sections required is 15.
Light Green Sections
You can use an arithmetic sequence to represent the number of triangles in each row since the number of triangles increases by 1 in the next consecutive row.
The formula for the nth term of an arithmetic sequence is below.

d is the common difference and  is the first term in the sequence.
For the light green sections, there are no light green triangles in the first row and the number of light green triangles increases by 1 in the next row. This means  and
and 
Using the formula the nth term of the arithmetic sequence is the following.


Now that the nth term of the sequence has been established we will find the sum of the rows. Each term in the sequence represents the number of light green triangles in that row. The sum of the sequence will give us the total number of light green triangles.
The formula for the sum of the first n terms of an arithmetic sequence is below.
![S_n=sum{i=1}{n}{{[}{{a_1+(i-1)d}}}{]}= n/2(a_1+a_n) S_n=sum{i=1}{n}{{[}{{a_1+(i-1)d}}}{]}= n/2(a_1+a_n)](https://math15fun.com/wp-content/plugins/wpmathpub/phpmathpublisher/img/math_957.5_976d6fb39024cedb0ec1dc70cd4fcf52.png)
There are five rows of dark green triangles. The sum the first five rows of light green triangles is represented by the symbols below.

To use the formula we need the first term, the last term and n. The first term in the sequence is 0 (0 light green triangles in the first row. The last term in the sequence is 4 (4 light green triangles in the last row. Since there are a total of 5 rows, n is 5.


The number of light green sections required is 10.
Example: Rewrite the given quadratic function in standard form by completing the square. Then state the domain, range, vertex, x-intercepts, y-intercept, the orientation (opens up or opens down), and the axis of symmetry. Finally graph the function.

Solution:
Rewrite function in standard form.


Here is a youTube video that demonstrations the process.
Find the vertex.
When the quadratic function is written in standard form you can identify the vertex as (h,k).


The vertex of the quadratic function is  .
.
Find the orientation.
The leading coefficient of the quadratic function is negative so the parabola opens down.
Find the y-intercept.
To find a y-intercept let x=0.


The y-intercept is (0,8).
Find the x-intercept.
To find an x-intercept let y=0 or f(x)=0.


 or
or 
 or
or 
Find the axis of symmetry.
The axis of symmetry is a vertical line that passes through the vertex. Since the vertex is  the axis of symmetry is
  .
.
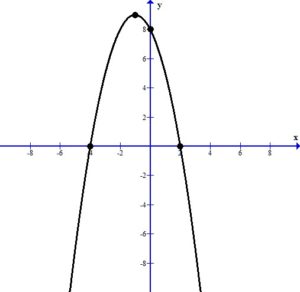
Graph the function.
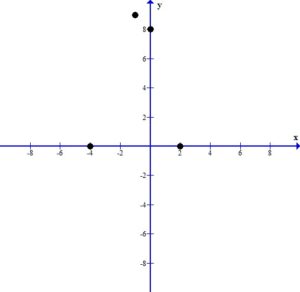
Plot the intercepts and the vertex.

Since the vertex is the highest point we can draw the parabola using the peak at the vertex.

Find the domain and range.
The domain is  .
.
The range is 
![- infty, 9 {}{]} - infty, 9 {}{]}](https://math15fun.com/wp-content/plugins/wpmathpub/phpmathpublisher/img/math_981_cf307bba3f49c962fc8d40a950c676b1.png) .
.
Here a few video examples of analyzing the graph in general form.
The Distance Formula
Suppose A is  and B is
The distance between points A and B is given by the following formula.

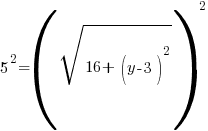
Example: Find the y-coordinate of the points that are 5 units away from the point (3,3) that have an x-coordinate of -1.


 or
or 
 or
or 
The Distance Formula
Suppose A is  and B is
The distance between points A and B is given by the following formula.

Example: Find the distance between points A and B.
Point A is  and point B is


The Midpoint Formula
Suppose A is  and B is
The midpoint of the line segment joining points A and B is given by the following formula.

Example: Find the midpoint of a line segment joining points A and B.
Point A is  and point B is
The x coordinate of the midpoint can be found by averaging the x-values of point A and B. The y-coordinate of the midpoint can be found by averaging the y-values of point A and B.


Slope Intercept Form

m is the slope of the line and  is the y-intercept
Point Slope Form

m is the slope of the line and  is a point on the line.
Standard Form of a Line

Example: Graph the linear equation using the slope and the y-intercept. (the slope is positive and fractional)
Example: Graph the linear equation using the slope and the y-intercept. (positive and negative fractional slopes)
Example: Graph the linear equation using the slope and the y-intercept. (equation written in standard form)
Example: What are parallel and perpendicular lines?
Example: How are the slopes of parallel and perpendicular lines related? (only watch until 1 min 20 seconds)
Example: Are the lines parallel, perpendicular or neither?
Example: Are the lines perpendicular to each other?