All posts by admin
Draw the Graph of an Ellipse
Find the Domain of a Logarithmic Function
Converting an Exponential Equation to a Logarithmic Equation
Periodic and Continuous Compound Interest
Solve an Exponential Equation: Relating the Bases
Problem: Solve the exponential equation.

Solution:
 |
|
The bases of the exponents on each side of the equation can be made the same. 36 can be written as  and and  can be written as can be written as  |
  |
|
Use the power rule for exponents to multiply the exponents. |
   |
| Exponential functions are one-to-one thus giving us the property that if the bases are the same the exponents are equal. If  then then  |
  |
  
|
|
   |
|
    |
The solution to the equation  is
is  .
.
Here is a video example of a similar type of problem.
Condense a Logarithm
Problem: Use the properties of logarithms to rewrite the expression as a single logarithm. Whenever possible, evaluate logarithmic expressions.

Soluton:
 |
|
 |
  |
  |
|
  |
  |
| Since these base of the exponential expressions are the same, combine using the power and quotient rules for exponent. Product Rule for Exponents:  Quotient Rule for Exponents:  |
   |
| Find a common denominator to combine the fractions. |    |
Here is a video with a similar example worked out.
Rational Function: Sketch the graph of the rational function
Problem:
Sketch the graph of the rational function using algebra techniques.

Solution:
To start sketching the graph, gather the following information about the graph.
Domain, vertical asymptotes, holes/removable discontinuities, horizontal asymptotes, oblique/slant asymptotes, points where the graph crosses the horizontal asymptotes, x-intercepts, and y-intercepts.
Find the Domain of a Rational Function
Division by zero is undefined. Having a zero as the denominator is equivalent to division by zero thus is also undefined. The rational function is undefined for any value of the variable that gives a zero denominator. Find these values by creating an equation to solve. The equation is the expression in the denominator equal to zero.
 |
|
| Solve the equation. This equation is a quadratic equation and can be solved by factoring, the square root method, completing the square or the quadratic formula. |  |
| Solve by the square root method. Start by isolating the square. |    |
| Cancel out the square by square rooting both sides. |    |
| The solutions to the equation are 3 and -3. |  or or  |
The values 3 and -3 give a zero value in the denominator and must be excluded from the domain.
In set builder notation, the domain is 
In interval notation, the domain is 
Find Vertical Asymptotes and Holes/Removable Discontinuities
A vertical asymptote occurs when there is a non-zero in the numerator and a zero in the denominator. To find the location of any vertical asymptotes, find the values where the denominator is zero but only after reducing the fraction so that we can guarantee that there is a non-zero in the numerator.
  |
|
  |
|
 |
|
| Solve the equation. This equation is a quadratic equation and can be solved by factoring, the square root method, completing the square or the quadratic formula. |  |
| Solve by factoring. Factor the expression on one side. |   |
| Use the zero product property and set each factor equal to zero. |   or or  |
| Solve each equation. |  or or   or or   or or  |
The rational function has vertical asymptotes at x=-3 and x=3. That means that y approaches  or
or  as x approaches the values of 3 and -3. Knowing this will guide us when sketching the graph.
Determine if the graph has any holes/removable discontinuities. In this example, since the rational function was in lowest terms there is no hole/removable discontinuity.
Find Horizontal Asymptotes and Oblique/Slant Asymptotes
Find the horizontal asymptotes using a set of rules based on the degree of the numerator and the degree of the denominator.
Horizontal Asymptote and Oblique/Slant Cases
 |
|
Case 2: The degree of the numerator is equal to the degree of the denominator. |
The horizontal asymptote is y= the ratio of the leading coefficients. There is no oblique/slant asymptote. |
Case 3: The degree of the numerator is one more than the degree of the denominator. |
There is no horizontal asymptote. There is an oblique/slant asymptote. Find it using long division. |
| Case 4: The degree of the numerator is two or more than the degree of the denominator. |
There is no horizontal asymptote and there is no oblique/slant asymptote. |
For this example, the numerator is 1 and the degree of the numerator is 0. The denominator is  and the degree of the numerator is 2. Since the degree of the numerator is less than the degree of the denominator (case 1) the horizontal asymptote is y=0. That means that y approaches 0 as x approaches
  or
or  . Knowing this will guide us when sketching the graph.
Find any Points that Cross the Horizontal or Oblique Asymptote
The horizontal and oblique asymptotes describe the graph as x approaches  or
or  , usually called the end behavior. The graph will approach the asymptote but not reach the asymptote at the ends of the graph. However, the graph can cross the horizontal or oblique asymptote in the middle section of the graph. To find were the graph crosses the horizontal or oblique asymptote, set the value of the asymptote equal to the function.
For this example, set the horizontal asymptote (y=0) equal to the function  .
.
Horizontal Asymptote = Function


Since there is no solution to this equation, there are no points where the graph crosses the horizontal asymptote.
Find the Intercepts of the Rational Function
To find a y-intecept let x=0.


The y-intercept is 
To find the x-intercept let y=0 or f(x)=0. Exclude solutions that were found to be undefined for the function when the domain was found.


Since this equation has no solution. There is no x-intercept.
Sketch the Graph
Draw the asymptotes as dashed lines. These will be used as guides to draw the graph. For this example, the vertical asymptotes were at x=-3 and x=3 and the horizontal asymptote was at y=0.
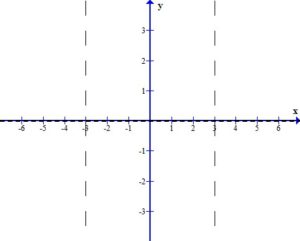
Plot the intercepts, holes or places where the graph crosses an asymptote. For this example, the only value is the y-intercept.
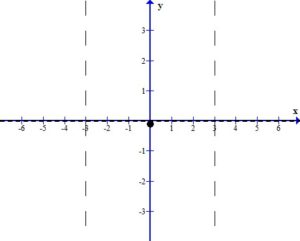
More points are needed to sketch the graph. Choose points in every section of the graph, using the vertical asymptotes to divide the sections up.
For example, choose x=-4 to represent the left section. The middle section needs a few extra points since it is surrounded by asymptotes. Choose x=-2 and x=2 to represent the middle section. Choose x=4 to represent the right section.
 |
|
 |
|
| 2 |  |
| 4 |  |
Plot the points on the graph.
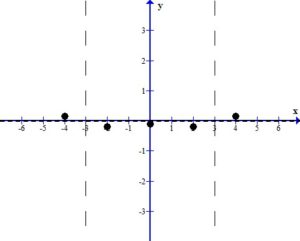
Use the definition of the asymptotes to draw the graph near each point.
In the left section, consider the graph as x approaches  (
( ).
).
Since the graph has a horizontal asymptote at y=0,  as
as  . As you draw the graph to the left of -4, approach the horizontal asymptote.
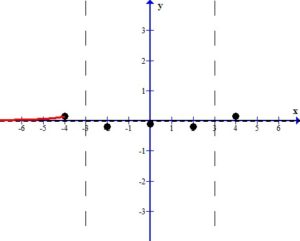
In the left section, consider the graph as x approaches -3 from the left ( .)
.)
Since the graph has a vertical asymptote at x=-3,  or
or  as
as  . Since the point in the left section lies above the horizontal asymptote and it was determined that the graph does not cross the horizontal asymptote,
  . As you draw the graph to the right of -4 approach the vertical asymptote going towards positive infinity.
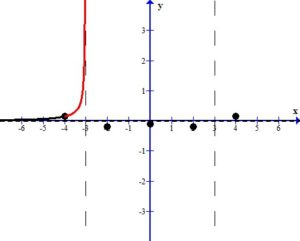
In the middle section, consider the graph as x approaches -3 from the right, ( .)
.)
Since the graph has a vertical asymptote at x=-3,  or
or  as
as  . Since the point near -3 in the middle section lies below the horizontal asymptote and it was determined that the graph does not cross the horizontal asymptote,
  . As you draw the graph to the left of -2, approach the vertical asymptote going towards negative infinity.
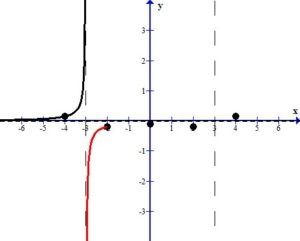
In the middle section, the three points can be connected to each other since there are no undefined values between them.
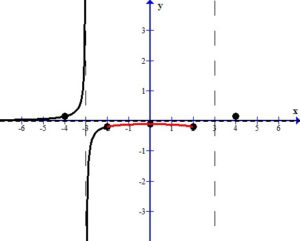
In the middle section, consider the graph as x approaches 3 from the left, ( .)
.)
Since the graph has a vertical asymptote at x=3,  or
or  as
as  . Since the point near 3 in the middle section lies below the horizontal asymptote and it was determined that the graph does not cross the horizontal asymptote,
  . As you draw the graph to the right of 2, approach the vertical asymptote going towards negative infinity.
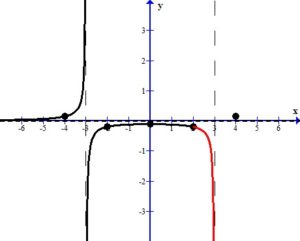
In the right section, consider the graph as x approaches 3 from the right ( .)
.)
Since the graph has a vertical asymptote at x=3,  or
or  as
as  . Since the point in the right section lies above the horizontal asymptote and it was determined that the graph does not cross the horizontal asymptote,
  . As you draw the graph to the right of 4 approach the vertical asymptote going towards positive infinity.
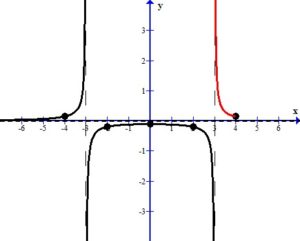
In the right section, consider the graph as x approaches  (
( ).
).
Since the graph has a horizontal asymptote at y=0,  as
as  . As you draw the graph to the right of 4, approach the horizontal asymptote.
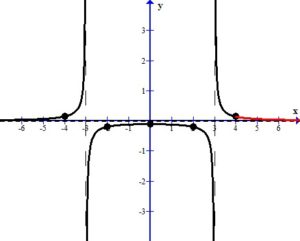
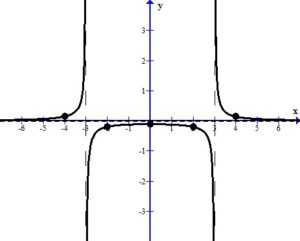
The sketch of the rational function  is below.
Here are some video examples that might help.
TI Calculator: Maximum, Minimum, and Zeros
http://resources.chuh.org/staff/aklein/Alg2/TI_max%20min%20zeros.pdf
This is a link to screen shots and instructions for finding the minimum, maximum and zeros of a function using a TI graphing calculator.
Quadratic Equation: Completing the Square
Example: Solve the quadratic equation by completing the square

Solution:
 |
|
   |
|
    |
|
   |
  |
| The left hand side factors to be a perfect square |    |
| Simplify the right hand side by finding a common denominator and adding the fractions. |      |
| Solve the equation using the square root method. Start by taking the square root of both sides to get rid of the square |    |
| Solve for x by subtracting 2 from both sides. |    |
| Rationalize the denominator by applying the radical to the numerator and denominator |   |
Rationalize the denominator by multiplying by the fraction  |
     |
https://www.youtube.com/watch?v=tHxc3fO8yOo
