An x-intercept is where the graph touches or crosses the x-axis.
A y-intercept is where the graph touches of crosses the y-axis.
To find an x-intercept: Let y=0 and solve for x.
To find an y-intercept: Let x=0 and solve for y.
Example: Find the intercepts of the circle for the given equation.
^2+(y+2)^2=4")
Solution:
To find an x-intercept, let y=0 and solve for x.
^2+(0+2)^2=4")
^2+(2)^2=4")
^2+4=4")
^2+4-4=4-4")
^2=0")
^2}=sqrt{0}")


This equation has one x-intercept. ")
To find a y-intercept, let x=0 and solve for y.
^2+(y+2)^2=4")
^2+(y+2)^2=4")
^2=4")
^2+1-1=4-1")
^2=3")
^2}=sqrt{3}")


Approximately  and
and 
This equation has two y-intercepts. ") and
and ")
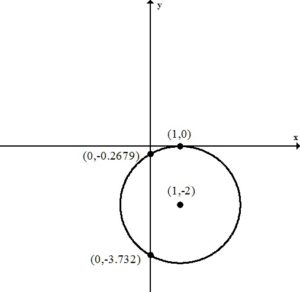
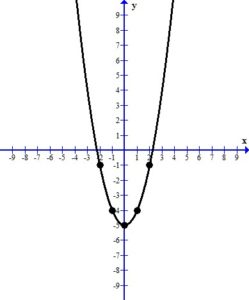
A tangent line to a circle may be defined as a line that intersects the circle in a single point.
This circle is tangent to the x-axis since it is touching the x-axis in a single point. The x-axis (y=0) is the tangent line for the point on the circle (1,0).
Example: Find the intercepts of the circle for the given equation.
^2+(y-1)^2=9")
Solution:
To find an x-intercept, let y=0 and solve for x.
^2+(0-1)^2=9")
^2+(-1)^2=9")
^2+1=9")
^2+1-1=9-1")
^2=8")
^2}=sqrt{8}")


Approximately  and
and 
This equation has two x-intercepts. ") and
and ")
To find a y-intercept, let x=0 and solve for y.
^2+(y-1)^2=9")
^2+(y-1)^2=9")
^2=9")
^2+9-9=9-0")
^2=0")
^2}=sqrt{0}")


This equation has one y-intercept. ") .
.
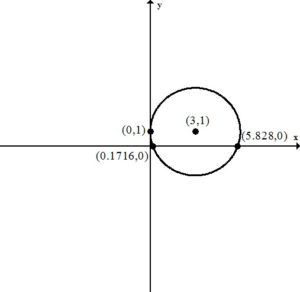
This circle is tangent to the y-axis since it is touching the y-axis in a single point. The y-axis (x=0) is the tangent line for the point on the circle (0,1).
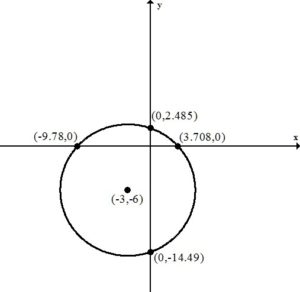
^2+(y+6)^2=81")
^2+(0+6)^2=81")
^2+(6)^2=81")
^2+36=81")
^2+36-36=81-36")
^2=45")
^2}=sqrt{45}")


 and
and 
") and
and ")
^2+(y+6)^2=81")
^2+(y+6)^2=81")
^2=81")
^2+9-9=81-9")
^2=72")
^2}=sqrt{72}")


 and
and 
") and
and ")

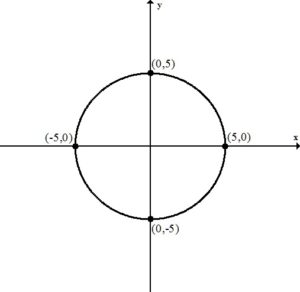
^2=25")


") and
and ")
^2+y^2=25")


") and
and ")
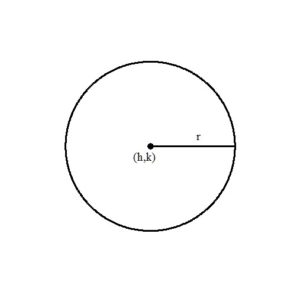
^2+(y-k)^2=r^2") where r is the radius and
where r is the radius and ") is the center.
is the center.") . So
. So  and
and  .
. .
.^2+(y-7)^2=6^2")
^2+(y-7)^2=36")
(x-5)+(y-7)(y-7)=36")


^2+(y-3)^2=16")
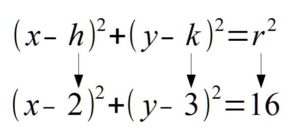
 . In the binomial with y, the number after the minus sign is k. Thus,
  . The
. The  lines up with 16. So
  which means
  .
.") and a radius of
and a radius of ^2+(y-4)^2=25")
 is the same as
 ") .
.)^2+(y-4)^2=25")
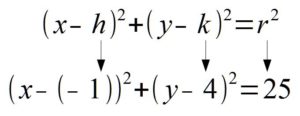
 . In the binomial with y, the number after the minus sign is k. Thus,
  . The
. The  which means
  .
.") and a radius of
and a radius of ^2=12")
 is the same as
 ") .
. is the same as
  .
.^2+(y-(-7))^2=12")
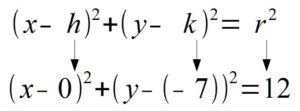
 . In the binomial with y, the number after the minus sign is k. Thus,
  . The
. The  which means
  .
.") and a radius of
and a radius of  .
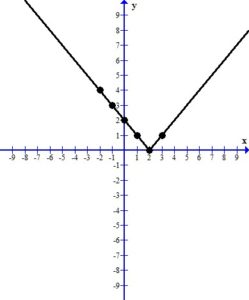
. by the plotting points method.
, (-1, 3), (0, 2), (1, 1), (2, 0)")
") which I get from plugging three into the equation for x.
which I get from plugging three into the equation for x.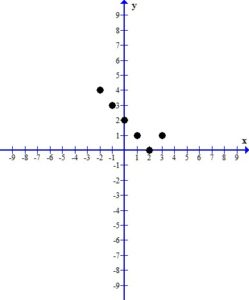
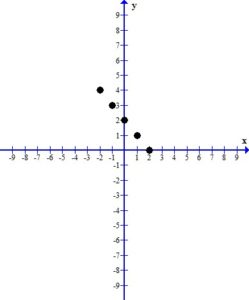
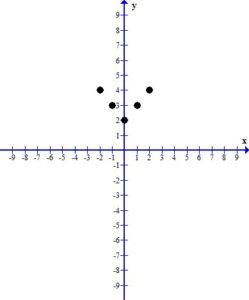
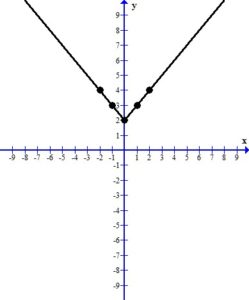
 by the plotting points method.
, (-1, 3), (0, 2), (1, 3), (2, 4)")
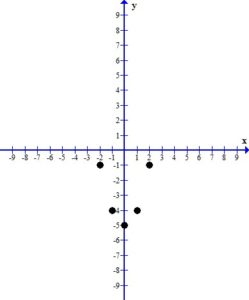
 by the plotting points method.
, (-1, -4), (0, -5), (1, -4), (2, -1)")
 by the plotting points method.
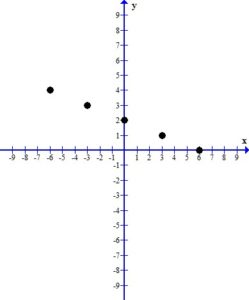
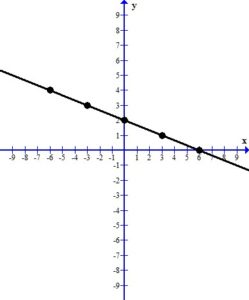
, (-3, 3), (0, 2), (3, 1), (6, 0)")
 .
. by the plotting points method.
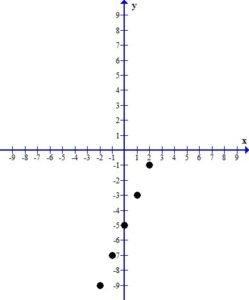
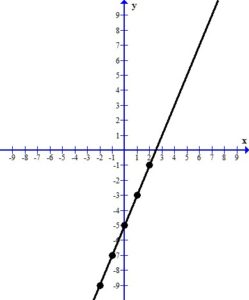
, (-1, -7), (0, -5), (1, -3), (2, -1)")