Plotting Points Method
- Find ordered pair solutions
- Choose values for one variable
- Find the value for the other variable
- Plot the ordered pair solutions
- Draw the line or curve that connects the ordered pairs
Example: Graph  by the plotting points method.
1. Find ordered pair solutions. We can organize this information in a table.
- Choose values for one variable
When the equation is written in “y=” format it is easier to choose values for x and then find the y’s. Although you are allowed to choose any x values, for this table I have used a standard set of x’s so that we have a variety. Some negatives, some positives and zeros.
| x | y |
|---|---|
| -2 | |
| -1 | |
| 0 | |
| 1 | |
| 2 |
- Find the values for the other variable
To find the y’s substitute the value of x into the equation and simplify to find y.
| x | y | y | y |
|---|---|---|---|
| -2 | |-2-2|= | |-4|= | 4 |
| -1 | |-1-2|= | |-3|= | 3 |
| 0 | |0-2|= | |-2|= | 2 |
| 1 | |1-2|= | |-1|= | 1 |
| 2 | |2-2|= | |0|= | 0 |
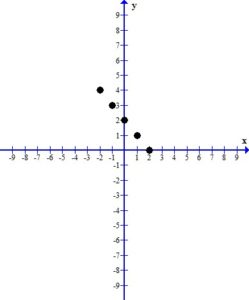
2. Plot the ordered pair solutions
Using the table above we have 5 ordered pairs , (-1, 3), (0, 2), (1, 1), (2, 0)")
Plot the ordered pairs using the rectangular coordinate system.
3. Draw the line or curve that connects the ordered pairs.
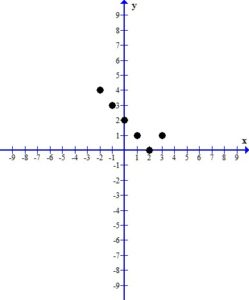
When you look at the plotted ordered pairs you should see a pattern the that points make. As I discussed in a previous post, most absolute value graphs form a “v” shape. It seems I am not graphing the portion of the graph that shows the “v” shape. With the plotting points method all I can do is find more ordered pairs to try to get the correct graph. However, in a future post, we will discuss other graphing methods give us more information about where the interesting part of the graph is.
In the mean time, to finish this graph I need just one more ordered pair. ") which I get from plugging three into the equation for x.
which I get from plugging three into the equation for x.
This makes the graph have the “v” shape we expected.
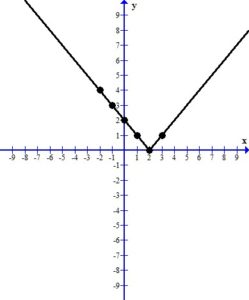
The line represents all of the ordered pairs that are solutions to the equation .